6.4 EMP_diff_analysis
The module EMP_diff_analysis supports difference analysis of experimental data under different grouping conditions, encompassing various statistical testing methods such as T-test, Wilcoxon test, one-way ANOVA test, Kruskal-Wallis test, DESeq2, edgeR, and limma. This module not only supports multi-core parallel computing to enhance efficiency, but also features a caching snapshot function (i.e., when the same parameters are used for calculation repeatedly, the system automatically retrieves the cached results without the need for re-computation).
6.4.1 Traditional Statistical Methods
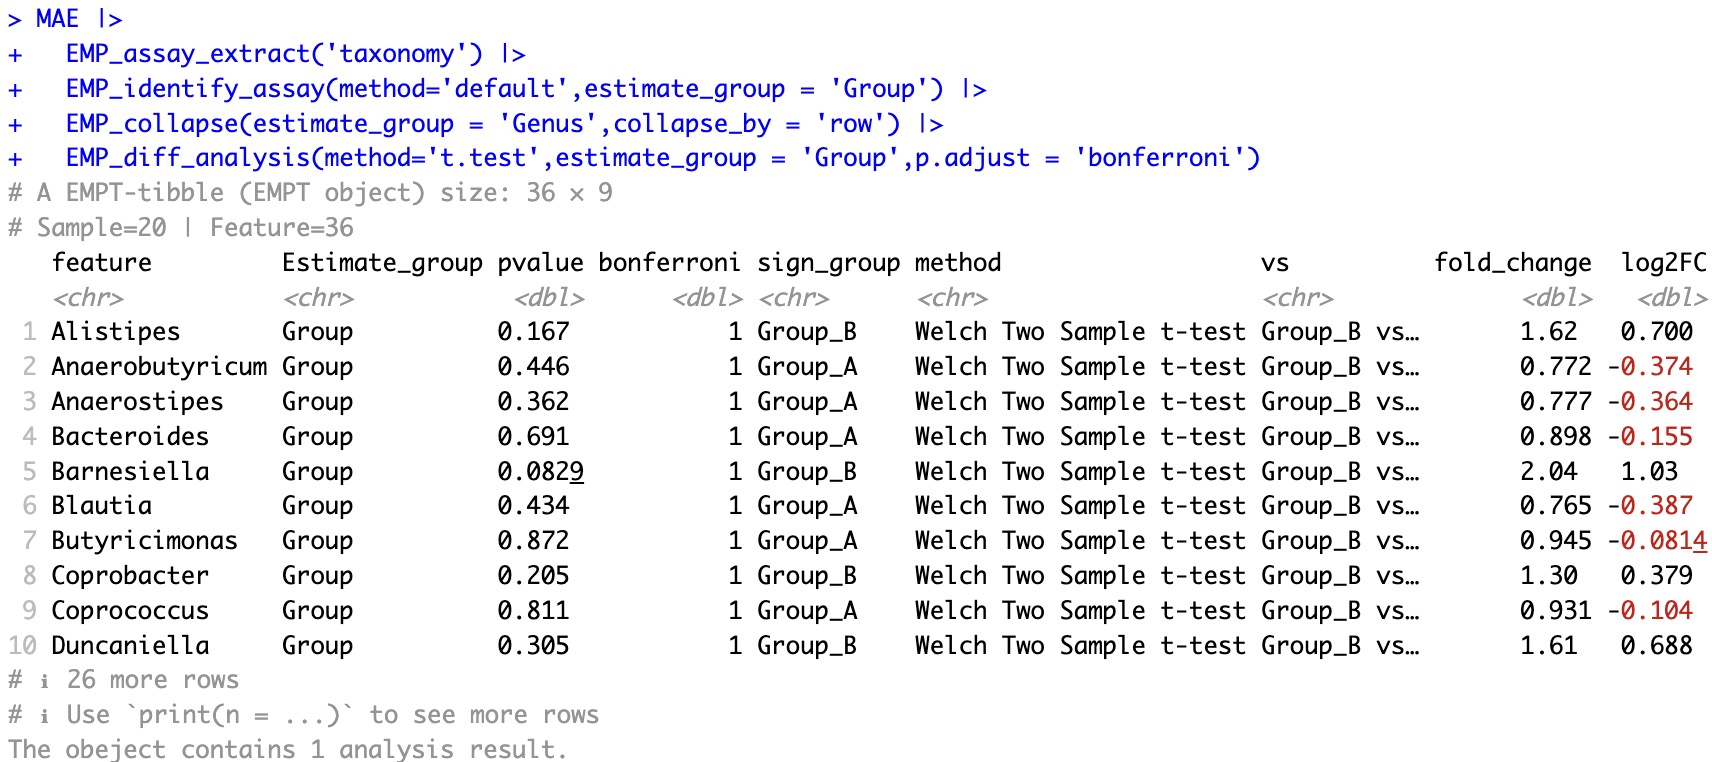
🏷️Example1:Perform difference analysis on core microbial data at the species level using a t-test, and apply Bonferroni multiple testing correction to the p-values.
① In the case of two groups,
sign_group displays the group where the feature's mean is higher than in the other group, but it does not involve statistical testing. In this example, for the feature column Alistipes, sign_Group is Group_B, indicating that the mean of Alistipes in Group_B is higher than in Group_A; combined with the pvalue column, the p-value of the T-test is 0.167, and the Bonferroni-corrected p-value is 1, indicating that the difference in the feature between groups is not statistically significant.② In the case of more than two groups,
sign_group shows the group with the highest mean for the feature among the involved groups, but it does not involve statistical testing. If the p-value in the pvalue column is less than 0.05, it indicates that the means of the involved groups are not all the same. To determine which specific groups have statistically significant differences in means, pairwise comparisons need to be performed.③ When calculating the fold change between two groups, if feature value is 0, the value will change into be one thousandth of the corresponding feature of the other set. In this case, the fold change is 1000 or 0.001.
④ For paired tests, please refer to Chapter 10.3 Paired tests for cohorts.
MAE |>
  EMP_assay_extract('taxonomy') |>
  EMP_identify_assay(method='default',estimate_group = 'Group') |>
  EMP_collapse(estimate_group = 'Genus',collapse_by = 'row') |>
  EMP_diff_analysis(method='t.test',estimate_group = 'Group',p.adjust = 'bonferroni')
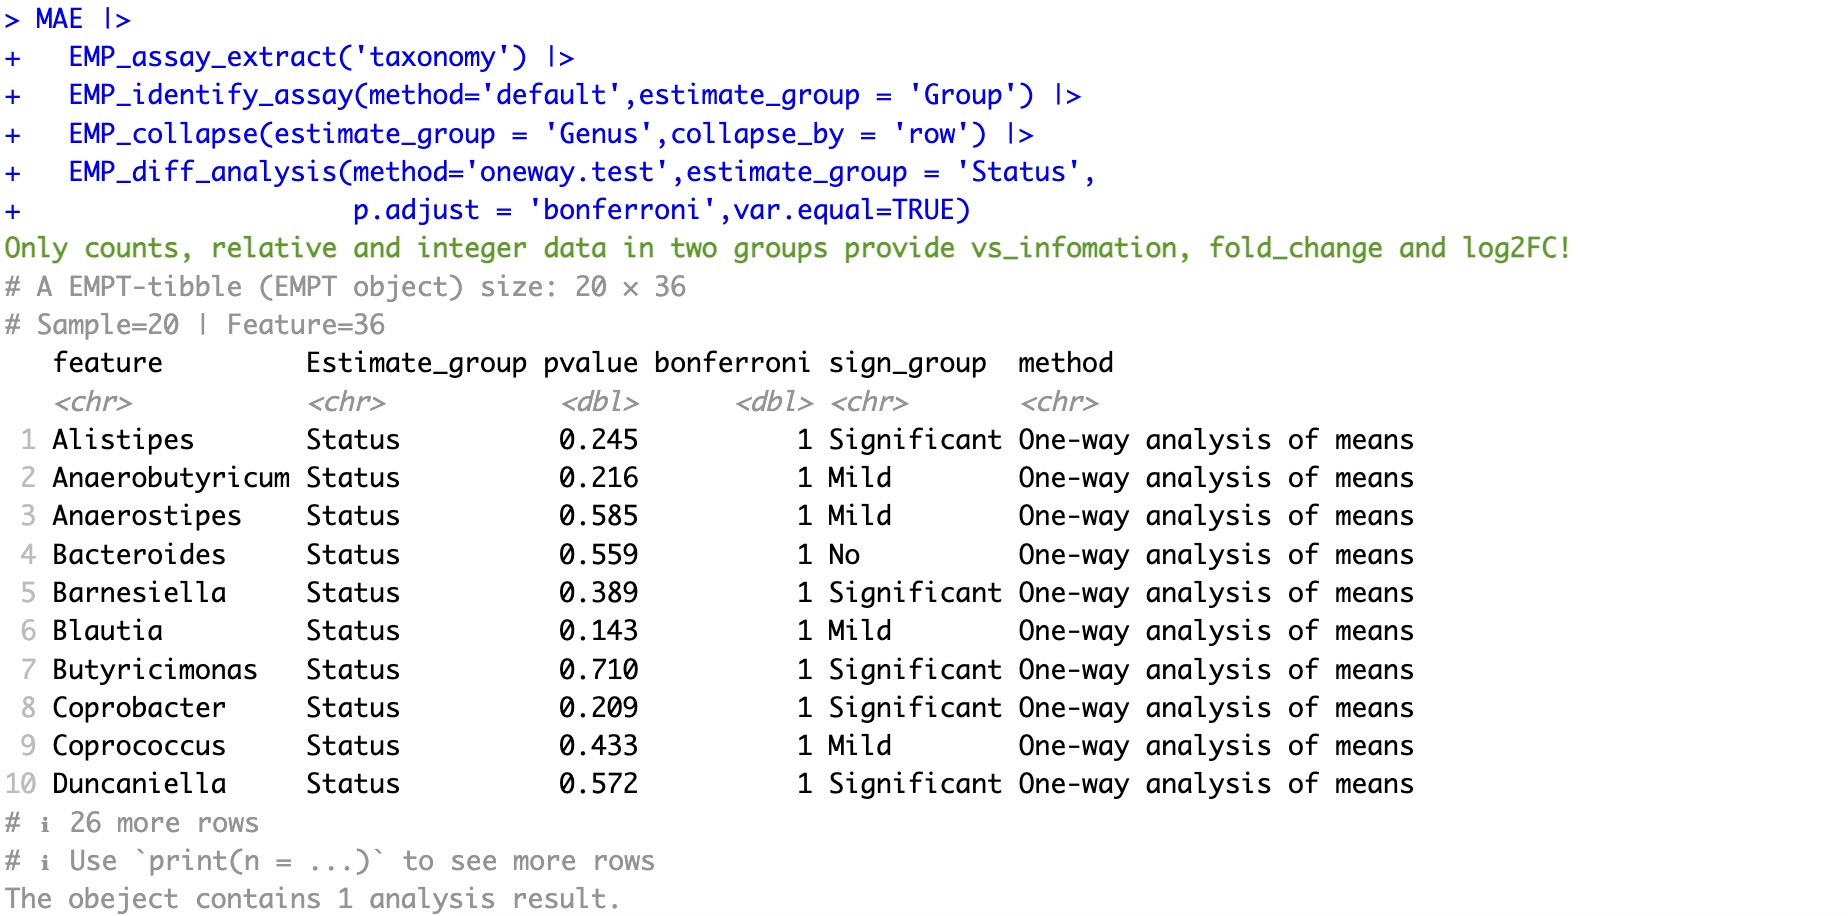
🏷️Example2:When grouping exceeds two groups, use oneway.test or kruskal.test for statistical testing.
① If there are more than two groups or if the input data is not
counts, relative, or integer, partial result such as fold_change and VSlog2FC will not be provided.② The module
EMP_diff_analysis inherits methods from the R built-in stats package, and additional parameters can be added within the module for adjustment.
MAE |>
  EMP_assay_extract('taxonomy') |>
  EMP_identify_assay(method='default',estimate_group = 'Group') |>
  EMP_collapse(estimate_group = 'Genus',collapse_by = 'row') |>
  EMP_diff_analysis(method='oneway.test',estimate_group = 'Status',
                    p.adjust = 'bonferroni',var.equal=TRUE)
6.4.2 DESeq2、edgeR and limma
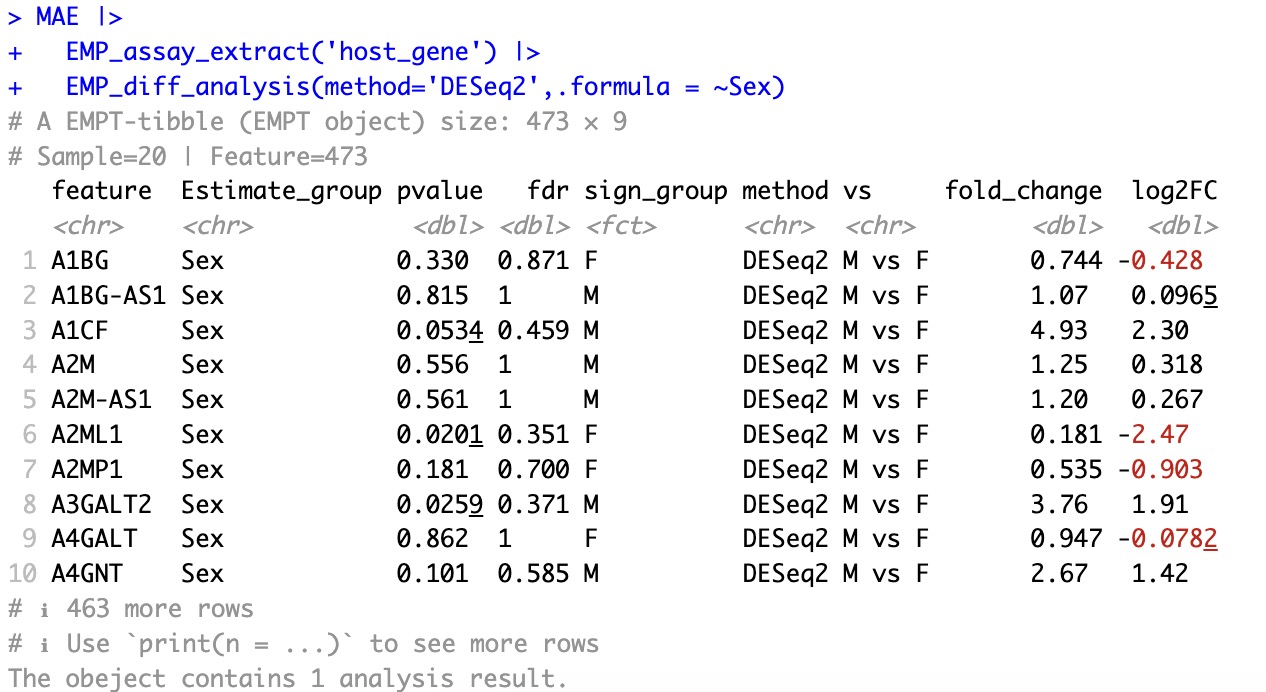
🏷️Example1:Using DESeq2 to conduct difference analysis of host gene datasets by sex.
When using these methods, the parameter
estimate_group for specifying group information is no longer used, instead following the convention of the inherited package's syntax .formula.
MAE |>
  EMP_assay_extract('host_gene') |>
  EMP_diff_analysis(method='DESeq2',.formula = ~Sex)
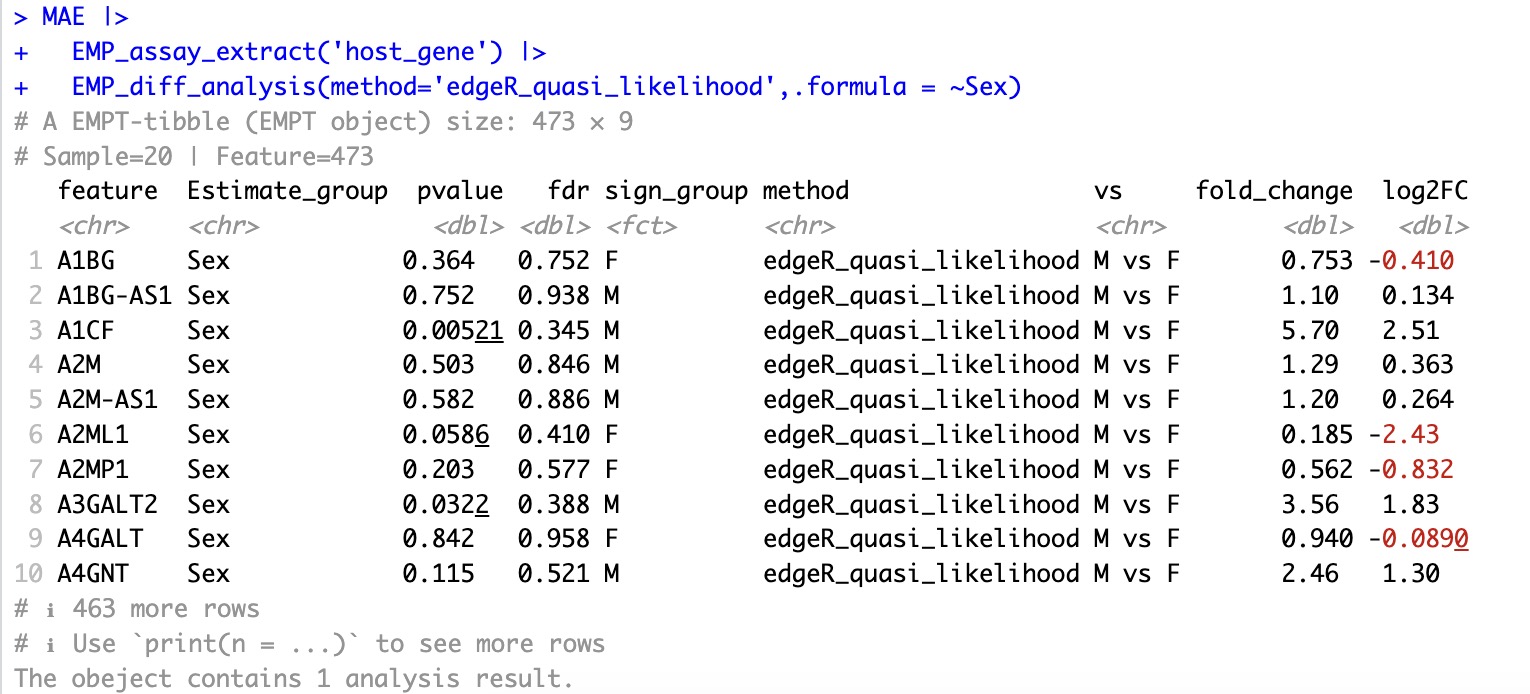
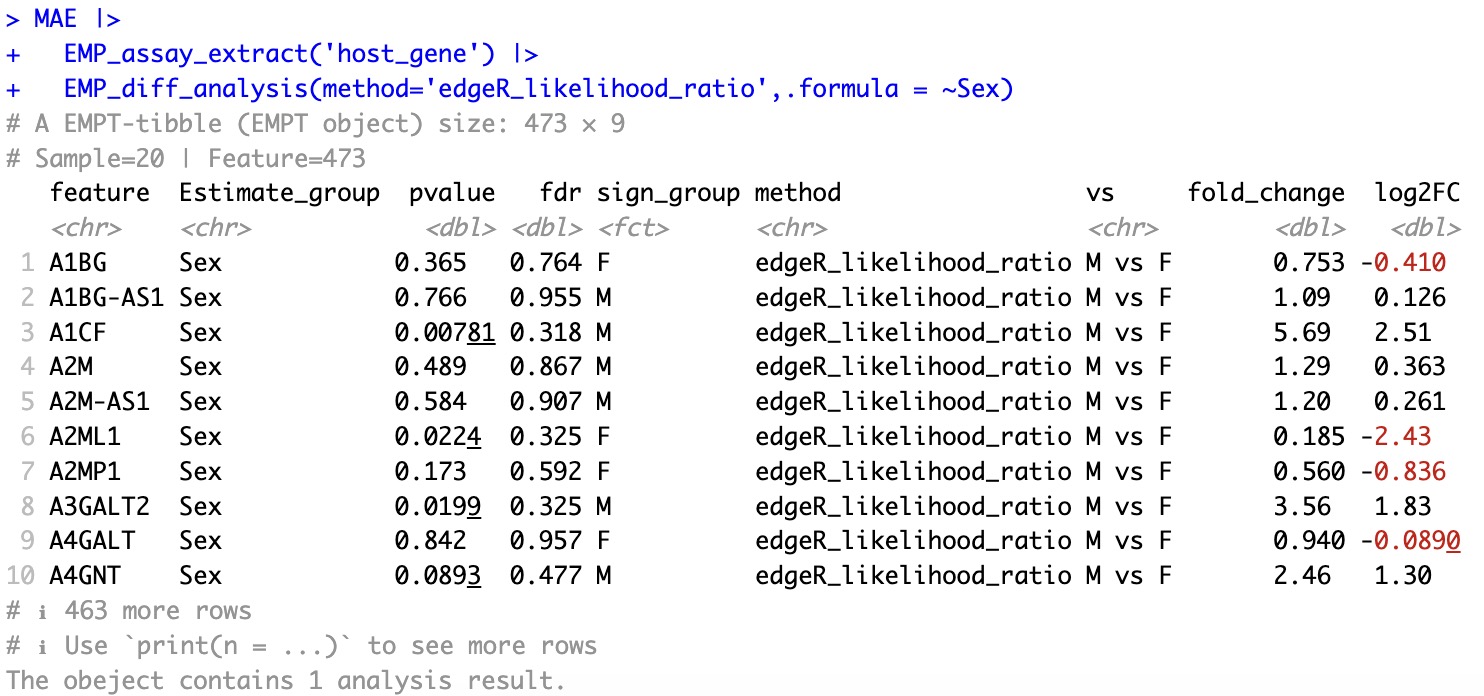
🏷️Example2:Various methods using edgeR.
MAE |>
  EMP_assay_extract('host_gene') |>
  EMP_diff_analysis(method='edgeR_quasi_likelihood',.formula = ~Sex)
MAE |>
  EMP_assay_extract('host_gene') |>
  EMP_diff_analysis(method='edgeR_likelihood_ratio',.formula = ~Sex)
🏷️Example3: More methods
MAE |>
  EMP_assay_extract('host_gene') |>
  EMP_diff_analysis(method='edger_robust_likelihood_ratio',.formula = ~Sex)

MAE |>
  EMP_assay_extract('host_gene') |>
  EMP_diff_analysis(method='limma_voom',.formula = ~Sex)

MAE |>
  EMP_assay_extract('host_gene') |>
  EMP_diff_analysis(method='limma_voom_sample_weights',.formula = ~Sex)
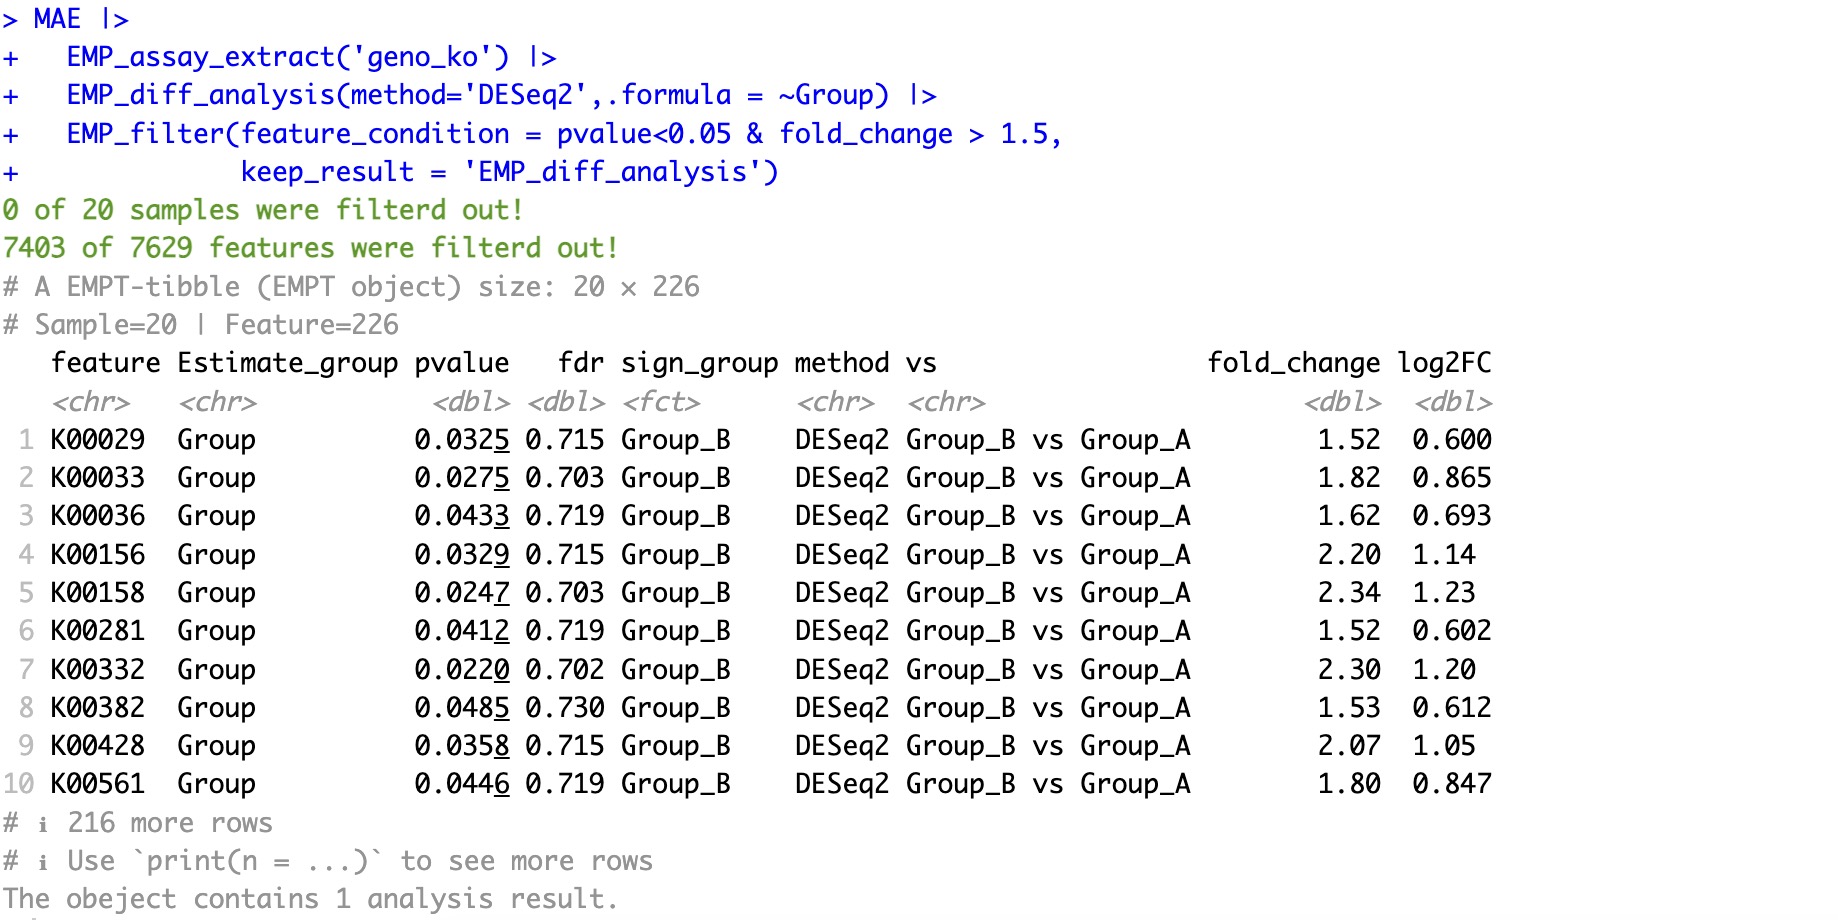
6.4.3 Filtering and visualization based on diff-analysis results
The module EMP_filter can assist in quickly filtering and analyzing results. For detailed usage, refer to the help documentation of Module EMP_filter.
The parameter
keep_result is explained in detail in Section 7.1.3.
MAE |>
  EMP_assay_extract('geno_ko') |>
  EMP_diff_analysis(method='DESeq2',.formula = ~Group) |>
  EMP_filter(feature_condition = pvalue<0.05 & fold_change > 1.5,
             keep_result = 'EMP_diff_analysis')
Draw the results of the difference analysis into a volcanic map.
Adding parameter
show='html' to the function EMP_volcanol_plot provides interactive graphics, which helps in quickly identifying specific details of differential features. See section 8.10 EMP_volcanol_plot for more details.
MAE |>
  EMP_decostand(experiment = 'geno_ec',method = 'integer') |>
  EMP_diff_analysis(method='DESeq2',.formula = ~Group)  |>
  EMP_volcanol_plot(key_feature = c('3.6.1.62','1.5.3.19'),
                    min.segment.length = 0, seed = 42, box.padding = 0.5) ## Add arrow